
The supervised approach to machine learning
Supervised learning is one of the most widely used machine learning approaches. It can be useful for predicting financial results, detecting fraud, recognizing objects in images and evaluating or assessing risk. The aim of supervised learning is to allow machine learning functions to work in such a way that enables the input data to be used to predict the output class for each new data instance for which the classification is not already known.
With supervised learning, the input data and output data (also called the class) are known in advance. This allows the model to be trained so that it produces the best predictions of classes for the training data by knowing when the model did and did not make a classification error (Figure 1). Subsequent to training the model with the labeled data set, the trained model can then be used to classify future input data with unknown classification.
As part of a supervised learning process, the machine learning system is required to identify circles in images from the data it receives. The result is a form of predictive modeling, whereby the machine recognizes the circles from the other shapes in images (Figure 1).
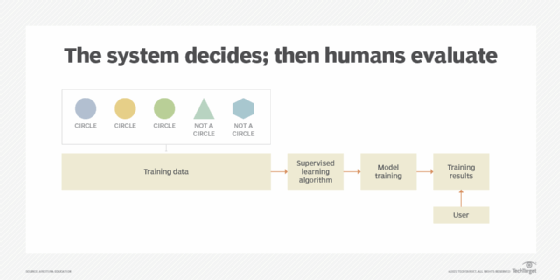
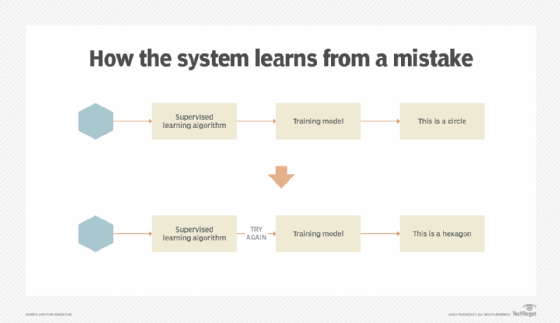
As the machine learning system continues to make decisions based on the data presented to it, the results of its decisions are reviewed (supervised) by the algorithm. When incorrect decisions are made during training with the labeled data, the algorithm has the opportunity to make adjustments as part of the training process (Figure 2).
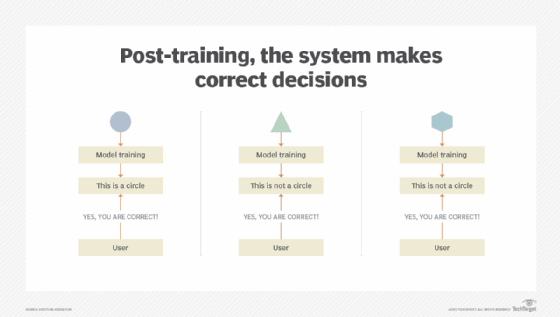
Once the model is trained and deployed, the machine learning system can make decisions based on new data it processes (Figure 3).
The following are common supervised learning algorithms, algorithm types and practices:
- Classification
- Decision tree
- Regression
- Predictive modeling
- Ensemble models and methods
Read on to learn more about these five algorithms.
Classification
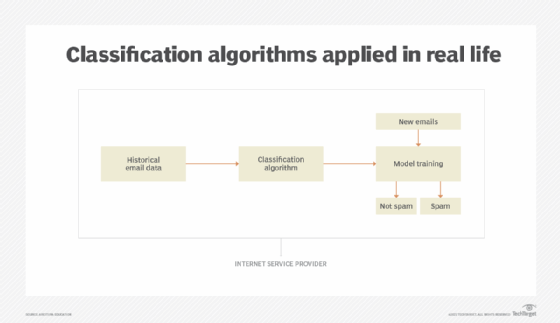
A problem is referred to as a classification when the output is expected to be a category -- such as a circle, a color, a type of car or an outcome. Take, for example, a problem that asks Based on historical weather data, will it rain on February 12? If the model predicts two class values, then the output could be rain and no rain. A classifier would not produce the probability percentage for rain, such as 90% chance of rain. For these types of problems several different classification algorithms and techniques can be used (Figure 4).
When the model is trained, different labels are assigned to different data classes (such as circles and triangles) to enable the model to determine which category the data belongs to.
Where classifications can help
To understand how classification algorithms work in machine learning, consider this hypothetical business case.
A toy company needs to determine how to distribute its inventory of toys across retail locations in different countries. It cannot give each retail store the same inventory because it has learned, over the years, that some types of toys consistently sell better in certain regions than others. Some toys, in particular, hardly sell at all in some regions.
They use a classification algorithm to mine the transaction records in their database as labeled examples in order to classify toy types for each region:
- Class A: types of toys that sell at a poor rate in this region.
- Class B: types of toys that sell at an average rate in this region.
- Class C: types of toys that sell at an exceptional rate in this region.
Once the classifier is trained, all new toys types are classified into one of the three classes for each region. Finally, the toy company proceeds to set inventory quantities for the stores in the different regions using this classification system. Toys that fall under Class A are stocked in modest quantities. Toys that fall under Class B are stocked at standard quantities. Toys that fall under Class C are stocked at high quantities.
The toy company uses a further classification algorithm specifically for toys that fall under Class A to break down those toys into additional classes. They study this information to try to better understand what may have been leading to poor sales in the past. For example, causes of poor sales may have been due to inaccurate marketing, regional competitors offering similar toys at a lower cost or cultural incompatibility with some types of toys.
Decision tree
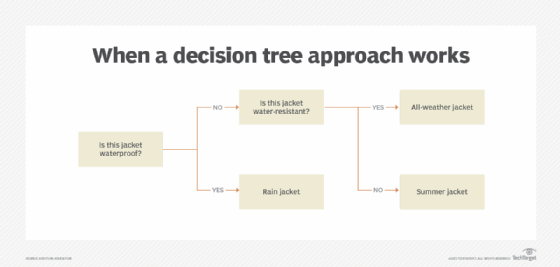
Decision tree algorithms are a form of classification algorithms that use rules organized into a flowchart. The rules are carried out sequentially so that once one decision is made, the algorithm moves on to the next (Figure 5).
When a decision tree approach works
If our hypothetical toy company wanted to establish a new feature for its online shopping site, it might use the decision tree approach. When a customer logs in and begins browsing the store, the site needs to be able to provide recommendations of toy products that match the customer profile information.
A decision tree algorithm is developed to narrow down which products to display by carrying out a sequence of decisions. It first decides whether the customer previously purchased a toy over $100 within the past 30 days. If the customer did, it then determines whether the customer has previously purchased toys for boys or girls or both. Based on the outcome of that decision, the algorithm produces a classification which is used to choose one or more products to display on the website while the customer is browsing.
For example, the leaf classifying customers as the type to make a recent purchase over $100 for a boy (named Class_Recent_Purchase_Boy by the analyst) would be presented with the top three best-selling toys for boys on the webpage.
The leaf classifying customers as the type of customer to make a recent purchase over $100 for a girl (named Class_Recent_Purchase_Girl by the analyst) would be presented with the top three best-selling toys for girls on the webpage.
Another leaf would further classify customers who buy toys for both genders (i.e., toys that are gender neutral) and customers who spent less than $100 within in the last 30 days. For these customers, generic recommendations are presented on the webpage.
Regressions
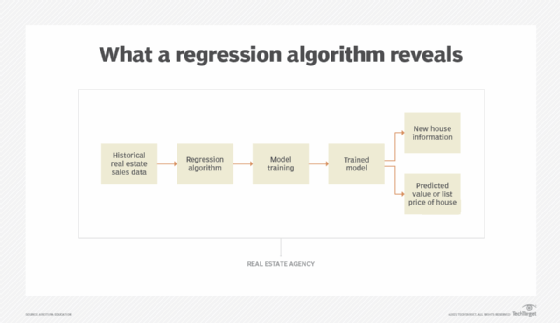
Regression is a method of modeling a target value based on independent predictors. A regression algorithm attempts to estimate the relationship across variables (Figure 6). Take, for example, the problem asked above: Based on historical weather data, what will the high temperature likely be on February 12?
Regression analysis is mostly used for tasks such as forecasting and determining cause and effect relationships. They are used when the results are expected to be quantifiable, such as a length, width, age and so on.
What a regression algorithm reveals
What if our hypothetical toy company is planning its marketing campaign for a new line of products. As part of the marketing campaign, it wants to send out promotional emails to its previous customers. Instead of sending out one email to all customers with information about all of its new products, it would like to customize the emails so they promote types of toys that certain customers are more likely to purchase.
They use a regression algorithm to match categories of toys with customer profiles to produce probabilities of certain types of customers purchasing certain types of toys. Historical customer transaction data is used to determine the types of toys a customer previously purchased, how frequently those types of toys were purchased and how much, on average, the customer spent on those types of toys. This information is used to generate the probability of a customer purchasing a new toy of the same type at a given price point.
For example, the algorithm determines that a customer who had previously purchased action figure toys five times over the past six months and who spent an average of $80 on each purchase is 71% likely to purchase a new action toy of the same type that is priced at $40.
The purchase probability of other toys is also assessed and compared, and the promotional email sent to that customer is customized to highlight the new toys with at least a 60% purchase probability at the toy's current price.
Ensemble methods
Ensemble methods help to improve the outcome of applying machine learning by combining several learning models instead of using a single model. The ensemble learning approach results in better prediction compared to when using a single learning model.
Some industry experts refer to algorithms used in ensemble methods as meta algorithms because they combine several learning techniques into one single model and use a complex method of prediction.

How ensemble methods can help
What if the toy company has a limited number of toy samples for a new line of toys it is releasing, and it would like to send the samples only to high-value customers to reward them for their loyalty? It is challenging to determine which customers should be valued more highly than others.
The company uses an ensemble method that will be applied to a combination of models, each of which represents a factor in determining the customer's value to the company. The following models are identified:
- total amount spent during all transactions to date;
- length of time the customer has made purchases; and
- whether the types of previous purchases are the same toy type as the sample.
The ensemble method factors in all three models. Ensemble voting is then used to determine whether the customer is considered high-value and will, therefore, receive the toy sample.
An ensemble model is the result of applying different ensemble methods. Ensemble methods can be used for stacking (improving prediction), boosting (bias) and bagging (decreasing the variance) purposes.
© 2021 LeackStat.com
